Although I’ve been an R user for some time, and have taught a variety of courses in R for statistics, I’ve never been a great user of the data science elements of R; I had a little spare time over the summer and have been trying to catch up with the tidyverse, mostly by starting with Hadley Wickham’s excellent book, R for Data Science
Whilst I’m not sure I’ll ever be a data scientist, I find the power of this quite amazing, especially compared to how I used to teach graphing in R. It does take a little more time, but filtering large data sets in R, and graphing becomes a breeze.
I’ve been working for some time on a statistical model for test cricket, which seems quite promising. I’ve used the yorkr package , modified a little for test cricket, in order to download every ball of test cricket from the excellent cricsheet website. There’s some 415 published test matches, and after some data issues I’ve so far successfully converted 399 of them.
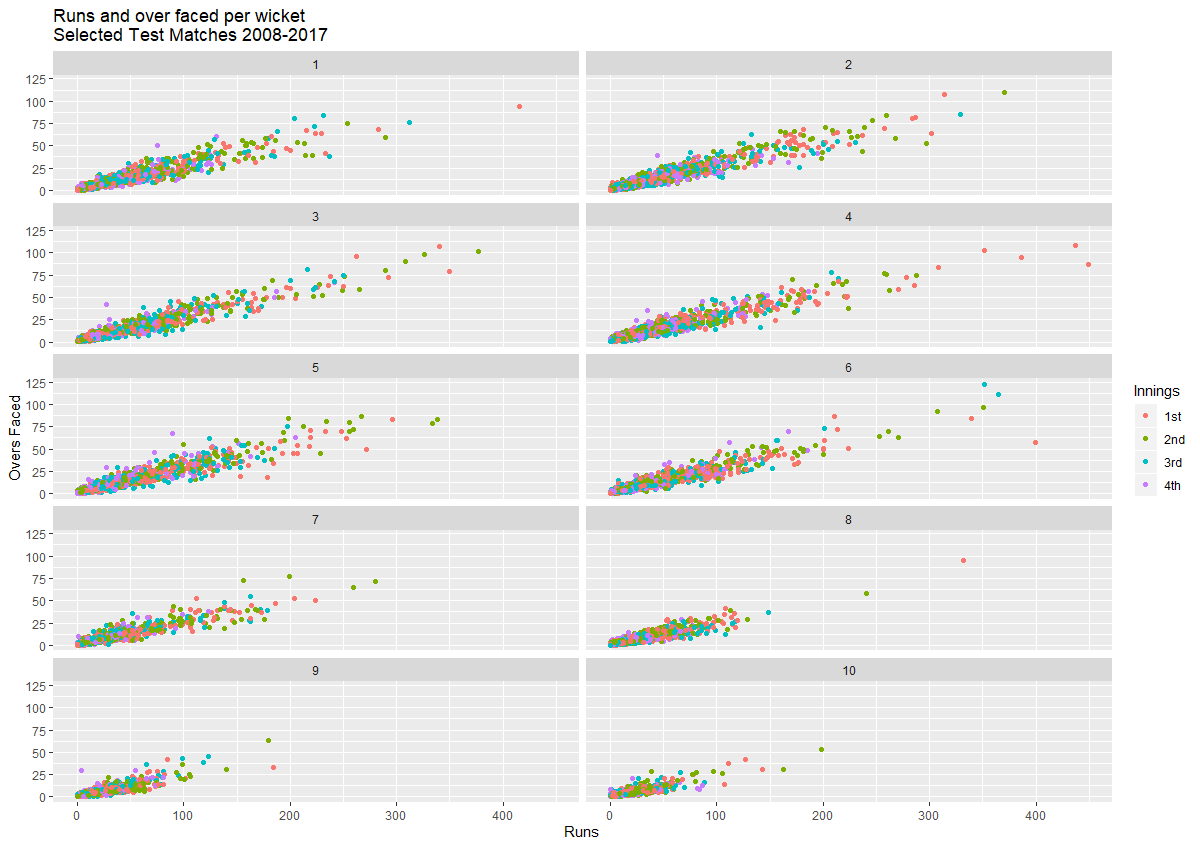
Anyway, to demonstrate how easy it is to get interesting results using the tidyverse, here’s some data on the number of runs scored and overs faced for each test wicket.
Code used to generate graphs:
> allTests

# A tibble: 13,084 x 9

# Groups: date, team, team1, team2, venue, innings [1,473]

date team team1 team2 venue innings innWicket oversPerWicket runsPerWicket

<date> <chr> <chr> <chr> <chr> <chr> <dbl> <dbl> <dbl>

1 2016-11-06 Sri Lanka Zimbabwe Sri Lanka Harare Sports Club 1st 1 14.7 62

2 2016-11-06 Sri Lanka Zimbabwe Sri Lanka Harare Sports Club 1st 2 1.83 4

3 2016-11-06 Sri Lanka Zimbabwe Sri Lanka Harare Sports Club 1st 3 7.67 18

4 2016-11-06 Sri Lanka Zimbabwe Sri Lanka Harare Sports Club 1st 4 3.83 28

5 2016-11-06 Sri Lanka Zimbabwe Sri Lanka Harare Sports Club 1st 5 50.5 143

6 2016-11-06 Sri Lanka Zimbabwe Sri Lanka Harare Sports Club 1st 6 26.5 87

7 2016-11-06 Sri Lanka Zimbabwe Sri Lanka Harare Sports Club 1st 7 11.7 54

8 2016-11-06 Sri Lanka Zimbabwe Sri Lanka Harare Sports Club 1st 8 18.5 75

9 2016-11-06 Sri Lanka Zimbabwe Sri Lanka Harare Sports Club 1st 9 0.333 0

10 2016-11-06 Sri Lanka Zimbabwe Sri Lanka Harare Sports Club 1st 10 8.67 33

# ... with 13,074 more rows

> ggplot(data = tempData) +

geom_point(mapping = aes(y = oversPerWicket, x = runsPerWicket, colour=factor(innings))) +

facet_wrap(~ innWicket, nrow = 5) +

ylab("Overs Faced") + xlab("Runs") +

labs(title="Runs and over faced per wicket\nSelected Test Matches 2008-2017",color="Innings")